
taxi.co.rs: from city queries to a national entity graph.
taxi.co.rs is an aggregator of taxi services in Serbia. This study shows how a national topic is divided into city hubs, fare pages, services and guides — with a clear separation between publicly verifiable facts and owner analytics.
What problem does the architecture solve?
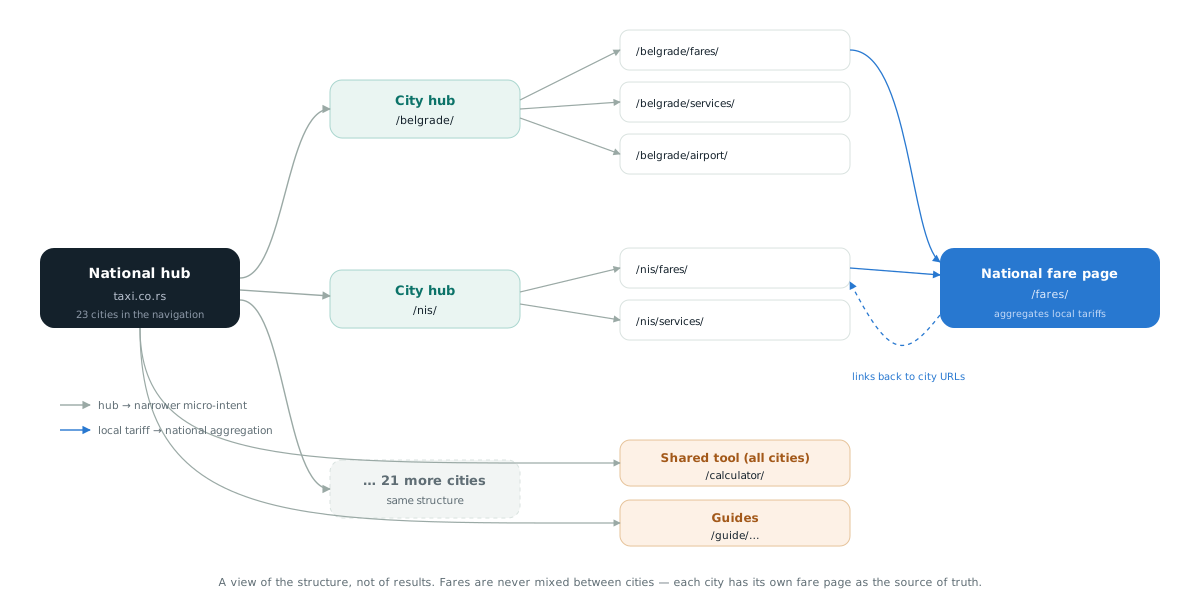
Nobody searches for an abstract “taxi Serbia”. They need a city, a phone number, a price, an airport or a specific route. Each city hub therefore has to gather the local entities and lead to narrower micro-intents, without mixing fares between cities.
How this structure was arrived at — which pages were rejected and on what criterion — is described in the decision log.
What can be verified publicly?
- The home page publicly lists 23 cities.
- The Belgrade fare page separates local tariffs, the calculator, the services and the methodology.
- The national fare page aggregates tariffs across cities and links to the local URLs.
Which results come from owner data?
Important: the figures below come from the project owner's Google Search Console account, exported on . They are not publicly verifiable without access to that account and are therefore not presented as independently confirmed.
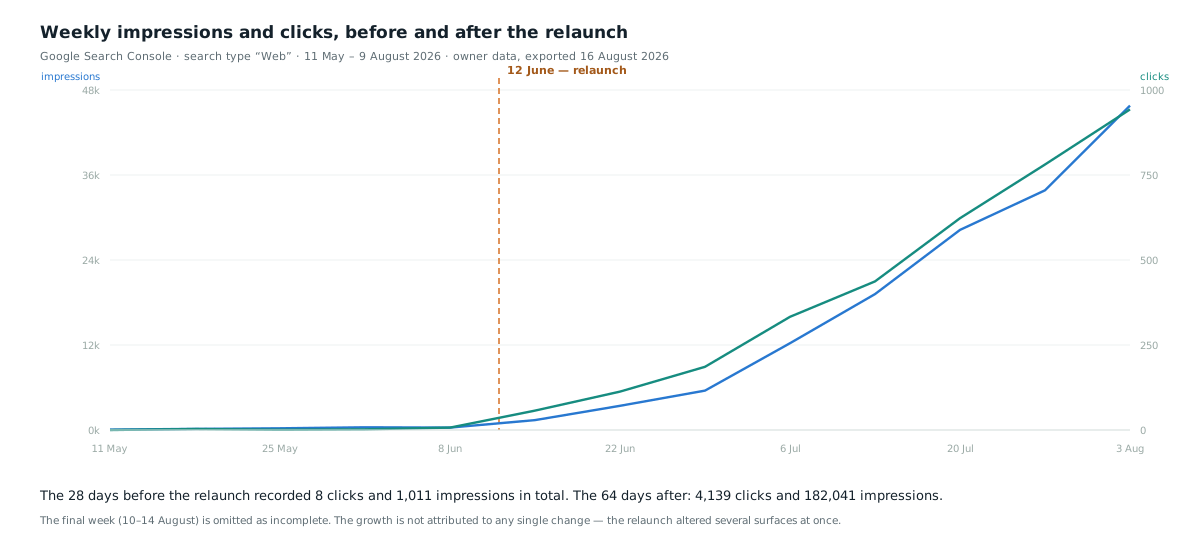
The site in this architecture launched on . The measured period is therefore 12 June – 14 August 2026 (64 days) rather than a full quarter: the 28 days before relaunch recorded just 8 clicks and 1,011 impressions, so a three-month average would dilute the picture rather than describe it.
| Measurement | Value | Source |
|---|---|---|
| Clicks | 4,139 | GSC, owner data |
| Impressions | 182,041 | GSC, owner data |
| Average position | 6.60 | GSC, owner data |
| Impressions in AI search features | 26,512 (14.6% of all) | GSC, Generative AI Features report |
/beograd/cenovnik/ | 652 clicks · 17,595 impressions · position 4.01 | GSC, owner data |
/cenovnik/ | 354 clicks · 15,269 impressions · position 5.35 | GSC, owner data |
What the growth looks like before and after the relaunch
| Month | Clicks | Impressions | Average position |
|---|---|---|---|
| May (17–31) | 4 | 408 | 7.48 |
| June | 223 | 6,765 | 7.23 |
| July | 2,085 | 86,235 | 6.53 |
| August (1–16) | 2,095 | 104,384 | 6.35 |
The chart shows growth that coincides in time, not a proven cause. The relaunch changed the architecture, the content and the technical implementation on the same day, so the effect of any single change cannot be isolated from this data.
Which pages does AI search actually use?
This is the only finding in the study that directly tests an architectural decision. If it is true that the city must carry the fare, then pages with a concrete, countable price should appear in AI answers more prominently than navigational hubs. The data supports that in the observed period.
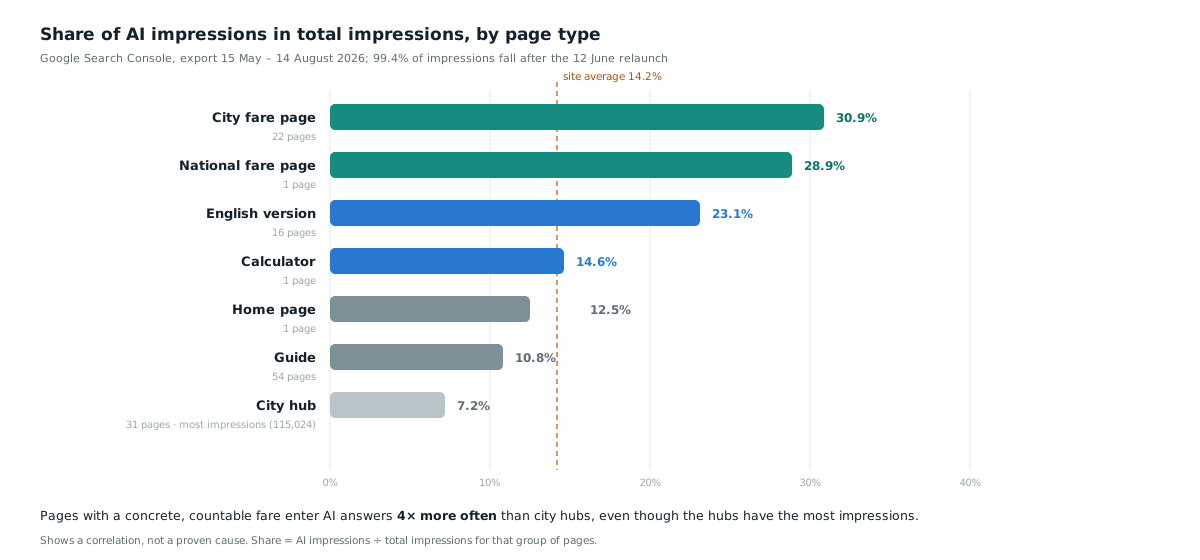
City fare pages enter AI answers in 29.1% of their impressions, city hubs in 6.8% — a difference of over four times, even though the hubs carry most of the total impressions. The same pattern repeats on the English version (/en/belgrade/taxi-fares/, 39.6%) and on guides answering a specific price question (27.4%).
All the shares above refer to one exported period, 12 June – 14 August 2026. How the AI impression share moves over time is not shown here: two measurements are not a trend, and the share also depends on changes inside the AI search features themselves, which we do not control and cannot separate from changes on the site.
Limitation: this is a correlation on one site, in one period, without a control group. It does not prove that adding a fare to any page would raise its AI share, nor that an AI impression brings a visit — Search Console's AI features report shows impressions only.
Where does information gain come from?
The advantage is not in generic paragraphs about taxis. It is in local tariffs, direct contact details for each service, the calculation formulas, the dates of verification, the stated limits of the calculator, and the link between the national and city pages. Every figure has to agree across the visible text, the calculator, the JSON-LD and the aggregate tables.
That consistency requirement is also where the project's two audit findings came from — both documented in the audit example.
What this study does not prove
- It does not prove that one schema type or one internal link produced the growth. The project changed across several surfaces, so the responsible conclusion is that the results belong to a system of content, technical implementation and indexing time — not to a single “SEO secret”.
- It does not isolate the effect of the relaunch from the effect of the architecture, because both happened on the same date.
- It does not establish that an AI impression leads to a visit.
- The page-type grouping is ours, derived from the URL structure. A different grouping would produce different percentages.
For a check on whether the same pattern holds elsewhere, see the control case — where the same approach produced a markedly weaker effect.
Frequently asked questions
Why is the measured period 64 days rather than a full quarter?
The site launched in this architecture on 12 June 2026. The 28 days before that recorded 8 clicks and 1,011 impressions in total, so including them would dilute the picture rather than describe it.
Does a high AI impression share mean more traffic?
Not necessarily. Search Console's Generative AI Features report shows impressions only, with no click data, so the relationship between AI presence and visits cannot be established from it.
Can the growth be attributed to the semantic architecture?
Not on its own. The relaunch changed several surfaces at once on the same date, so the results belong to the whole system rather than to any single change.
How these numbers are read, and why they are not added together, is set out on the page about measuring results.
The architecture in this study was set before the first page was published. The same approach on a new project is covered by semantic web development.
Building a site that has to cover a whole topic?
Send your sector, target markets and the number of pages planned.